

Australian Crop Update – Week 3, 2025
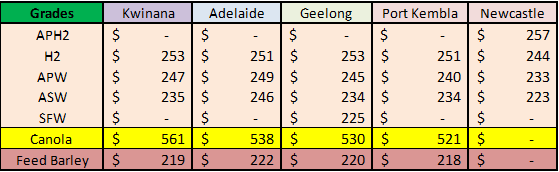
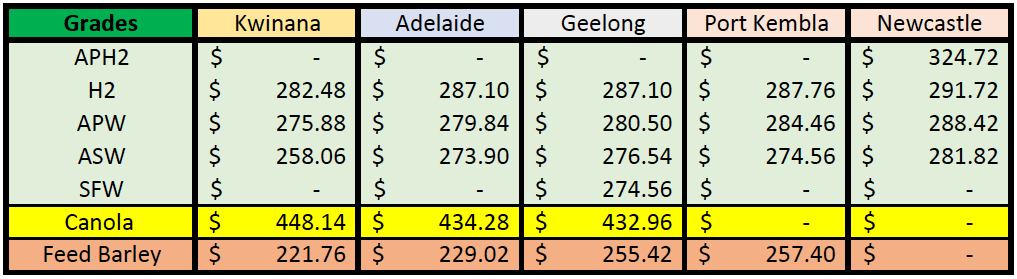
2024-25 New Season - USD FOB Indications
NEW CROP PRICES ARE BASED ON TRACK BID/OFFER SPREAD PLUS ACCUMULATION & FOBBING COSTS AND ARE NOT FOB PRICE INDICATIONS.
New Crop - CFR Container Indications PMT
Please note that we are still able to support you with container quotes. However, with the current Red Sea situation, container lines are changing prices often and in some cases, not quoting. Similarly with Ocean Freight we are still working through the ramifications of recent developments on flows within the region – please bear with us.
Please contact Steven Foote on steven@basiscommodities.com for specific quotes that we can work on a spot basis with the supporting container freight.
Australian Grains Market Update
Local markets were firmer to start the week as buyers reacted to Friday’s WASDE and continued weakness in the AUD in the face of a rampant USD. East coast basis continues to come under pressure as buyers look to improve export competitiveness into Asia and other key markets. However, this has done little to entice importers where demand is light and competition fierce. This is being reflected in softer values and a lagging export pace.
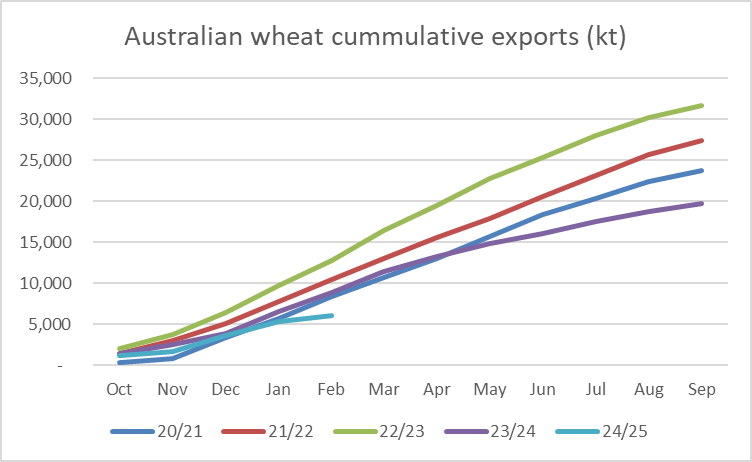
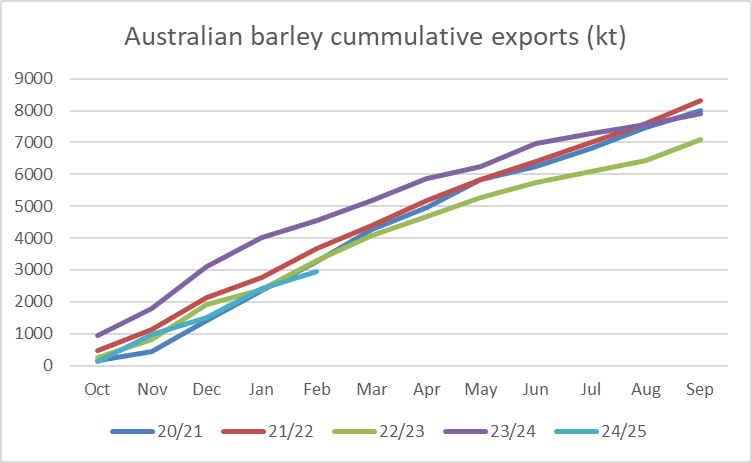
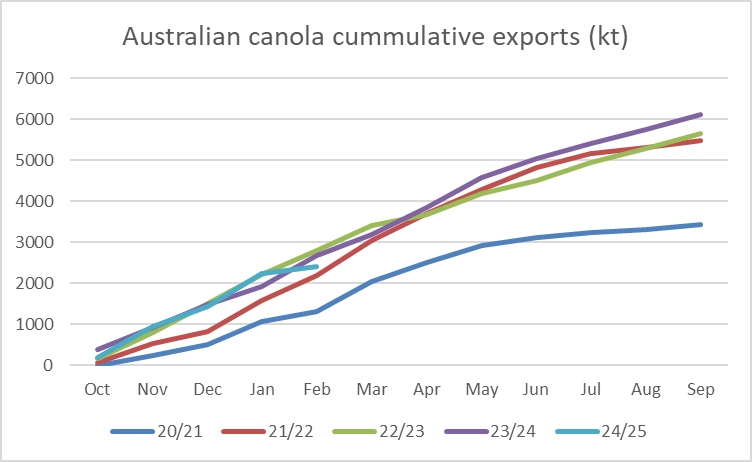
Australia’s 2024/25 winter crop harvest is now 99.9% complete. We updated the grain production estimates based on the final bulk handler grain delivery information. The major point of this is that larger than expected grain deliveries in Western Australia (WA) justify larger national wheat and barley crops. Overall, it was an amazing performance in WA where output exceeded all expectations where below average, but timely rains resulted in well above average yields. The above-mentioned production changes lifts Australia’s 2024/25 wheat crop to 33.3 million metric tonne (MMT), mainly due to the 1.8MMT increase in the size of the WA crop. We have lifted Australia’s wheat exports to 23.9MMT with room to go higher, demand allowing. National barley production is raised to 12.5MMT with exports of 5.5MMT. WA has sufficient supplies to lift exports comfortably above 6.0MMT, demand permitting. Australia’s canola production is steady at 5.9MMT with exports of 4.35MMT.
Export Stem & Ocean Freight Market Update:
The Australian Bureau Statistics released its November exports figures. Overall, wheat exports for November were disappointing while barley, canola and pulse exports were robust.
Australia exported 583.6 thousand metric tonne (KMT) of wheat in November down from 1.134MMT in Oct. It was the smallest Nov wheat exports since Nov 2020.
Barley exports for November were 839KMT which was the largest since Jan 2024. China took 750KMT of that.
November canola exports were 769KMT with 629KMT or of 72% of this heading to Europe.
Pulse exports kicked in November. This included 140KMT of faba beans with 94KMT of this coming from New South Wales (NSW) and 40KMT from Queensland (QLD). Egypt accounted for the bulk of the export demand with 126KMT shipped. Chickpea exports for Nov were 443KMT. India accounted for 350KMT of the shipments (79%), Pakistan 11% and Bangladesh 5%. There was also 49KMT of lentils exported in Nov.
There was 436KMT of wheat, 386KMT of barley and 128KMT of canola added to the stem in the past week. The data has been updated into the monthly shipping stable which now includes the Oct & Nov ABS exports as well as the shipping stem for Dec to Feb. Although there will be more Jan and Feb vessels that will come into the stem in coming weeks, a picture of the 2024/25 shipping pace is developing. With thanks to our analysts, we have introduced some additional charts to better illustrate this. In short, the wheat exports are lagging while canola and barley shipments are reasonably advanced. The below monthly shipping table shows wheat exports based on the ABS Oct-Nov and the stem for Dec-Feb.
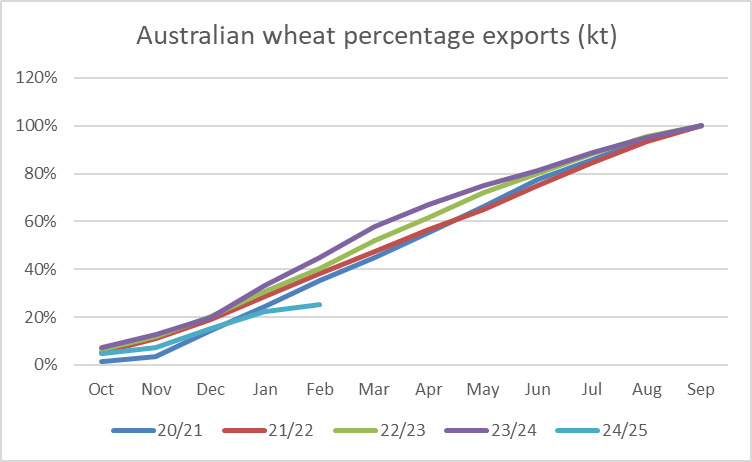
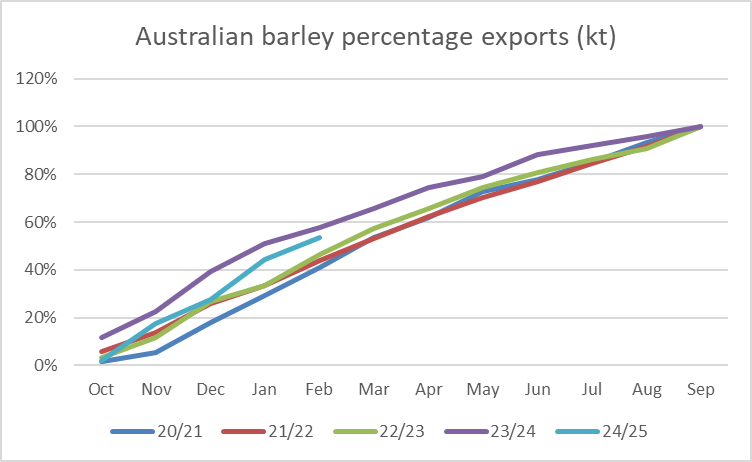
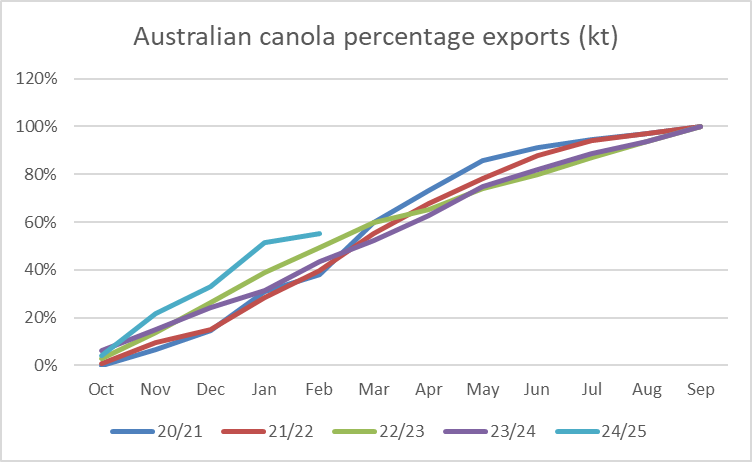
Source - Agscienta
From an ocean freight perspective, we are still waiting for the market to kick into gear for this year. It's been a slow start with minimal desire or urgency (especially on behalf of cargo interest) to engage. Instead, many participants are willing to take a wait and watch approach which appears to be working in their favour as the spot and forward curve have been very gently easing over the past few weeks. The big question on everyone's mind is how the market will react once Chinese New Year week comes and goes. Many are still sitting on the fence and are not prepared to make any bold predictions either way just yet so it will continue to be a close watch.
All index routes lost ground as the week progressed and while there was fixing being done, all rates were below last done levels. There have been minimal period fixtures being concluded as we have a big stand-off in the bid/offer spread between charterers and owners.
Australian Weather:
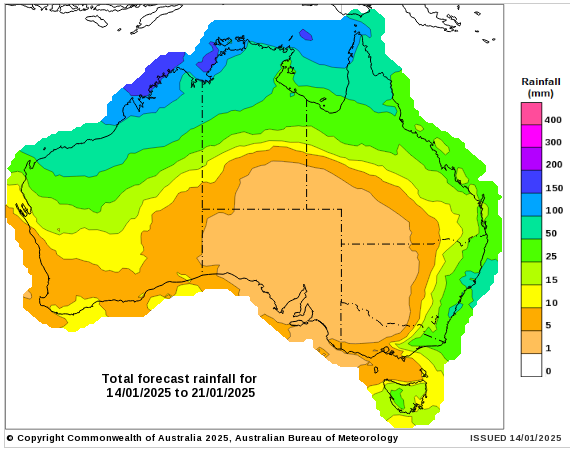
Rainfall across the Australian cropping areas last week was patchy and most areas of rainfall were coastal. Rain forecasts for the next week are somewhat similar however the expectations are for QLD, NSW and the eastern part of Victoria (VIC) to receive between 10-25mm which will do little for sub-soil with the summer temperatures expected to range between 25-35 degrees for the next week in these areas.
8 day forecast to 21st January 2025
http://www.bom.gov.au/

Weekly rainfall to 14 January 2025
http://www.bom.gov.au/
AUD/USD Currency Update:
The Australian dollar was weaker again to finish last week when valued against the Greenback closing at 0.6150. The USD and US short term interest rates jumped after US payrolls easily beat expectations. The US unemployment rate decreased by 0.1pt to 4.1. FOMC rate cuts are at risk. AUD/USD can test 0.6099 if the Australian labour market report is weak as expected.
USDA Summary (from Agscienta):
The USDA’s January WASE report was supportive corn and soybeans but neutral for wheat.
Wheat
USDA reported U.S. wheat ending stocks at 798 million bushels, in line with trade expectations for 785-825 million bushels. USDA also released its initial 2025/26 US winter wheat seedings report overnight where plantings were up 725,000 acres, which was not expected. This would add a further 50-60 mill bu of winter wheat production, assuming normal abandonment and trend yields. USDA’s global changes for the 2024/25 balance sheet were little changed in the Jan WASDE. Global wheat production was about unchanged at 793MMT, but world wheat exports were cut by 1.7MMT to 212MMT. Russia’s wheat exports were reduced by 1MMT to 46MMT and Ukraine was back 0.5MMT to 16MMT. China’s wheat imports were reduced by a further 0.5MMT to 10.5MMT compared to last year’s 13.6MMT. Turkey’s wheat imports were cut by 1.0MMT to 5.5MMT, compared to last year’s 9.4MMT and 12.1MMT in 2022/23.
Corn
USDA estimated U.S. corn production at 14.867 billion bushels, below market expectations for 14.965-15.193 billion bushels. USDA estimated U.S. corn yield at 179.3 bushels per acre, less than analysts' expectations for 181.3-183.7 bushels per acre. Ending stocks were at 1.54 billion bushels, at the low end of predictions for 1.540-1.815 billion bushels. Globally, USDA kept its South American production estimated unchanged (Argi 51.0MMT and Brazil 127.0MMT). Global corn production was cut by 3.5MMT to 1,214MMT with US production down 7MMT to 377.6MMT. Global exports were reduced by 1.6MMT to 191.4MMT. China’s 2024/25 imports were cut by a further 1MMT to 13MMT, down 10.3MMT from last year’s 23.4MMT. The full extent of the impact of this is only seen by looking at the 2023/24 numbers as well. USDA’s 2023/25 Brazil’s exports forecasts have been in free-fall in recent months. USDA cut Brazil’s 23/24 corn exports by a further 2MMT to 39.5MMT. This is 8.5MMT less than the 48MMT forecast in Sep24.
Barley
The most notable feature of the USDA’s 0.5MMT reduction in China’s 2024/25 barley imports to 9.5MMT. This is 6.4MMT below last year’s 15.9MMT. Russia’s barley production was lowered by a further 0.3MMT to 16.3MMT, down from 20.5MMT in 2023/24.
Soybeans
USDA estimated U.S. soybean production at 4.366 billion bushels, compared with analyst expectations for 4.408-4.539 billion bushels. They said U.S. soybean yield was at 50.7 bushels per acre lower than trade expectations for 51.1-52.6 bushels per acre. USDA put U.S. soybean ending stocks at 380 million bushels, below analyst predictions for 390-495 million bushels. USDA lifted its US soyoil forecasts, which was broadly expected and needed. Globally, USDA lowered world soybean production by 2.8MMT to 424.3MMT. This was due to the 2.6MMT reduction in US production to 118.8MMT. South American production was unchanged with Brazil at 169MMT and Argi 52MMT. China’s imports were unchanged at 109MMT. Global ending stocks were reduced by 3.5MMT to 128.4MMT, which is 16MMT more than last year and record large. Most of the reduction in world soybean stocks came from the 2.5MMT reduction in US ending stocks to 10.3MMT.
Canola
USDA made some significant changes to its historical Chinese rapeseed production assumptions which altered the historical balance sheets, although the trade numbers were little changed. World 2024/25 world production was reduced by 1MMT to 85.2MMT. This was made up of a 0.35MMT reduction in Russian to 4.65MMT and 0.5MMT cut in India’s output. Canada’s crop was unchanged at 18.8MMT, but exports were raised by 0.5MMT to 7.25MMT as they gain market share into the EU. EU imports were unchanged at 6.85MMT.
Share This Article
Other articles you may like

Sign Up
Enter your email address below to sign up to the Basis Commodities newsletter.
Newsletter Signup
Quick Links
Basis Commodities Pty Ltd
PO Box 340, Northbridge
NSW 1560, Australia
Basis Commodities Consulting DMCC
PO Box 488112
Dubai, UAE
Copyright © 2024 Pty Ltd. All rights reserved.
site by mulcahymarketing.com.au