

Australian Crop Update – Week 3, 2024
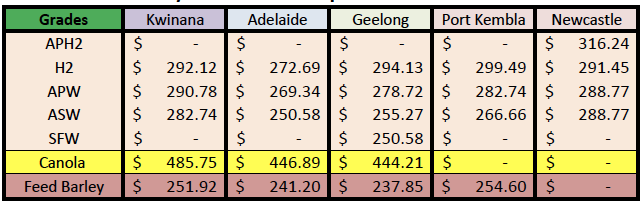
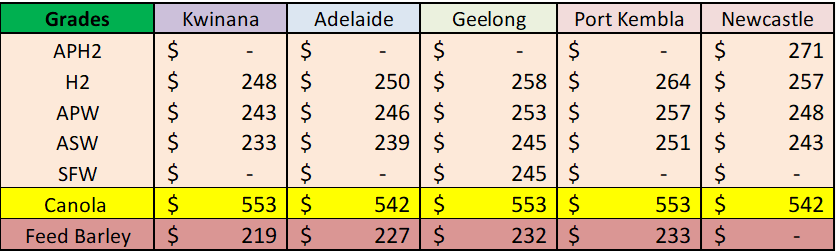
2023/2024 Season (New Crop) – USD FOB
NEW CROP PRICES ARE BASED ON TRACK BID/OFFER SPREAD PLUS ACCUMULATION & FOBBING COSTS AND ARE NOT FOB PRICE INDICATIONS.
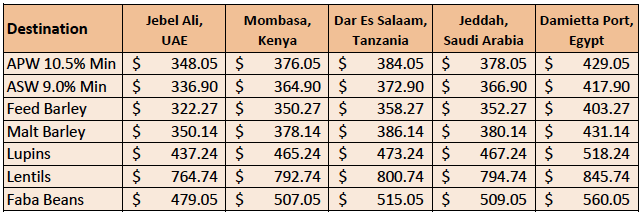
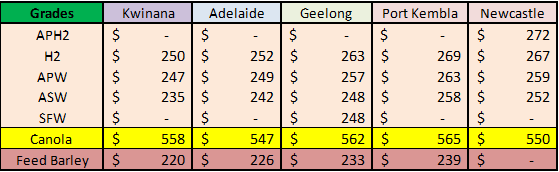
New Crop - CFR Container Indications PMT - LH feb/Mar 24 Shipment
THE BELOW PRICES ARE INDICATIONS TO THE MAIN CONTAINER DESTINATION, NOT FIRM OFFERS. TO OBTAIN SPECIFIC PRICING FOR SPEICIFIC GRADES AND QUALITIES, PLEASE CONTACT STEVEN FOOTE ON STEVEN@BASISCOMMODITIES.COM.
Australian Grains Market Update
The Australian grains market endured another quiet week as much of the industry is still enjoying the holiday break. Farmers are not engaging in selling, and with the large amount of on farm storage, they are not in a hurry to commit to selling more of this crop despite the perceived weakness in global markets.
ABS published its November export statsistics. There was 1.17 million metric tonne (MMT) of wheat exported in November down from 1.41MMT in October. Western Australia (WA) shipped 758 thousand metric tonne (KMT) so has now done 1.43MMT of its exports in the first two months of the 2023/24 crop year. Other states are less advanced which highlights the lack of engagement from the farmers and making a sale price that works for exporters. South Australia (SA) has shipped 430 KMT in Oct/Nov, while Victoria (VIC) has only shipped 360 KMT.
Indonesia was the largest destination with 217KMT followed by China with 185KMT and then Vietnam with 124KMT. Australia has only shipped 369KMT of wheat to Indonesia in the Oct/Nov vs 815KMT at the same time last year. Australian wheat isn’t competitive compared to the same point last year and consumers are accessing supplies
from a much wider range of origin and suppliers.
Australia exported 908KMT of barley in November which was down slightly from the 928KMT in October with China dominating the exports at 722KMT. Australia has already shipped 1.8MMT of barley to China since August 2023. The market consensus is that about 3.0MMT of barley has been committed into China which was made up of old and new crop.
Canola exports were strong in November with 544KMT up from 381KMT in October. WA accounted for 413KMT following the 260KMT shipped in October. It was a mixed range of destinations with about 46% going to France and Germany. About 22% went to the UAE with Japan, Pakistan and Mexico all receiving cargoes.
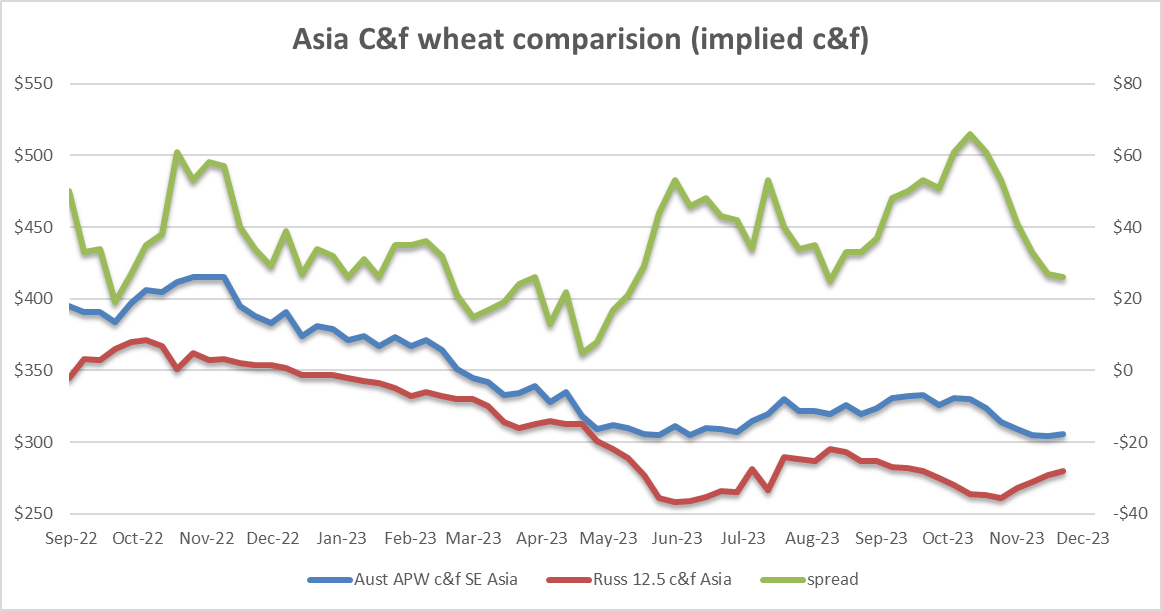
Overall demand is sluggish and mostly hand-to-mouth, which is making it difficult to get forward sales programs on the books. This is evident in the Australian sales wheat export program where exporters are showing a limited appetite to chase farmer supplies, other than juggling around stocks to cover prompt needs. Asian import programs have been very diversified compared to last year when they were dominated by cheap Aussie wheat. It’s a mix of most origins this year including Russia, Ukraine, EU, Canada and Australia as well as some US. Prices have to be sharp to get the business and it's only for nearby slots with buyers eying off the good start to the Black Sea 2024/25 winter wheat crops. They are hoping for another 88-90MMT Russian wheat crop which would keep global wheat markets on the defensive, despite the overall tight major exporter supplies. Supply problems are needed to change this narrative.
Our analyst released a supply and demand update during the week with some production adjustments based on the final state bulk handler receival data. Overall, wheat harvest in southern NSW and VIC came in better than expected as crops responded to the early October rain. However, wheat and barley crops in SA and WA have come in shy of expectations. The changes put the national wheat crop at 25.3MMT, down from the previous 26.0MMT. We have exports at 19.4MMT which is up on previous estimates because of the need to shift wheat exports from VIC to avoid large carryover stocks with the bigger crop. We also reduced WA exports with the smaller crop. The national barley crop is 10.2MMT with exports of 6.6MMT. National canola production is 5.55MMT with exports of 4.75MMT.
Ocean Freight & Shipment Stem Update:
There was 770KMT of wheat placed on the stem in the past week. This included 423KMT in WA and 318KMT in VIC.
The Ocean freight market has adopted a classic profile for the period between Christmas and Chinese New Year. Tonnage lists appear long across both oceans, and rates are heading lower as a result despite the turmoil in and around Yemen. After its recent spike, the Atlantic had the most scope to drop away and that is certainly happening but numbers remain a premium to the Pacific. The market is generally quiet with low levels of enquiry. Pacific round voyage on Panamax remains around the $10k per day level but we expect it to ease over the next couple of weeks. Supramax is a similar story with Atlantic front hauls still above $20k per day and Pacific round voyage drifting sub $9kpd.
The story of the week remains Yemen and whether the impact of air strikes by the US/UK spills over into the Middle East Gulf area. As previously mentioned, most new trans-Suez business is being calculated via Cape of Good Hope except for a minority of owners willing to take the risks into/through the Red Sea. We expect more of the same trends over the next couple of weeks as Chinese New Year approaches.
Australian Weather:
There has been significant rainfall across the eastern states of Australia over the past 7-10 days. Flooding has been seen in the growing regions of VIC with 50mm received for days at a time in Central VIC and Southern NSW. The coastal cities of Brisbane and Sydney have been hit hard with over 100mm received since Friday. Stormy weather is common this time of year with humidity and hot temperatures now pushing to the mid-30’s to 40 degrees forecast for the coming week in the country and on the coast. The weather is supportive of the 2024/25 season crop with strong moisture profiles to start the plant growth off well after sowing.
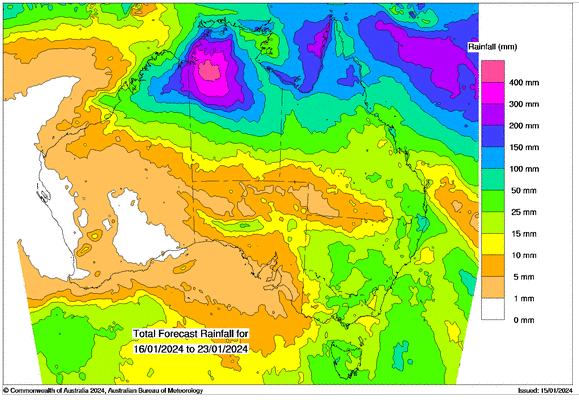
8 day forecast to 23rd January 2024
Source: http://www.bom.gov.au/

Weekly Rainfall to 15th January 2024
Source: http://www.bom.gov.au/
USDA Report Summary:
USDA released a raft of reports last weekend including the Jan 2024 WASDE report, the Dec 1 US quarterly stocks report and the US winter seedings estimate. The reports were broadly bearish with USDA raising US corn and soybean yields and lifting ending stocks. USDA trimmed Brazil’s summer crops and lifted the Argentine soybean crop, but total supplies increased. USDA also raised China’s corn crop by more than 10MMT which pushed global stocks solidly higher.
US wheat inputs were little changed. USDA jiggled around with the previous season's domestic usage which resulted in a slightly smaller carry in stocks. Globally, USDA lifted world 2023/24 production by 1.9MMT which was in Russia and Ukraine. Russian was up 1MMT to 91MMT and Ukraine 0.9MMT larger at 23.4MMT. World exports were raised by 2.3MMT to 209.5MMT (-10.7MMT year on year (y/y)). Russia increased by 1MMT to 51MMT, Ukraine was up 1.5MMT to 14MMT, Canada was up 0.5MMT to 24MMT and Australia was up 0.5MMT to 19MMT. EU exports were cut by 1MMT to 36.5MMT on the slow export pace. World wheat stocks were raised by 1.3MMT to 260MMT while major exporter wheat stocks were up 3.1MMT to 60.1MMT. EU ending stocks were raised by 2.5MMT to 15.3MMT.
Changes to the corn numbers were bearish on multiple fronts. USDA raised the US 2023/24 US corn yield to 177.3 bpa, a new record high. They lowered the harvested area to 86.5 million acres, but this still resulted in a record crop of 15.34 bill bu. Globally, USDA trimmed Brazil’s crop by 2MMT to 127MMT and left Argentina unchanged at 55MMT. The US crop was up 2.7MMT at 389.7MMT (+41.3MMT y/y). USDA also increased China’s crop by 11.8MMT to 288.8MMT (+11.6MMT y/y). World corn exports were trimmed by 0.7MMT to 190.8MMT on the back of a 1MMT reduction in EU imports. World corn ending stocks were increased by 10MMT to 325MMT (+10MMT in China and +1MMT in the US).
USDA raised the US soybean yield by 0.7 bpa while the harvested area was cut by 400k acres. The total crop was increased by 24 million bu to 4.165 bill bu. Stocks were trimmed slightly. USDA lifted the biofuel demand in the US by a further 1.5% and lowered exports, Biofuels demand now accounts for 48% of the US soyoil demand up from 40% in 2021/22. Globally, USDA cut Brazil’s soybean crop by 4MMT to 157MMT while Argentina was lifted by 2MMT to 50MMT. South America’s (Brazil, Arg and Paraguay) 2023/24 production is 217MMT which is +22MMT y/y. World soybean stocks were 0.4MMT higher to 114.6MMT which is +12.7MMT on y/y.
AUD/USD Currency Update:
The Australian dollar was slightly stronger against the US dollar (USD) last week, shrugging off risk aversion along with softer-than-expected economic data from the United States. The AUD/USD pair closed the week at 0.6696.
Share This Article
Other articles you may like

Sign Up
Enter your email address below to sign up to the Basis Commodities newsletter.